Training-run charts
The v0.6.x evalevalRunning the model against a held-out golden dataset and computing per-component F1, exact-match, calibration, and resolved-coordinate error. reports keep claiming things like "same noise pattern across runs" or "macro_f1 stable despite val_loss volatility." This article shows those claims visually and documents the tooling.
The v0.6.2 vs v0.6.2b comparison
Both runs trained on the v0.4.0 corpuscorpusThe BIO-labeled training data used to train Mailwoman's neural classifier. Assembled from real sources (OpenAddresses, National Address Database) and synthetic shards (boundary stress, order variants, negative space). Managed by @mailwoman/corpus. with synth-no-street added. v0.6.2 had
synth-no-street: 1.0; v0.6.2b dropped it to 0.5. Other knobs identical.
Each chart has a Linear / Log toggle — use log scale to examine small values and dampen large spikes; use linear to read absolute magnitudes.
val_loss over trainingtrainingThe process of adjusting a model's parameters so its predictions match labeled examples, by repeatedly measuring error and nudging the weights to reduce it. Distinct from inference, when the trained model is run on new input. steps:
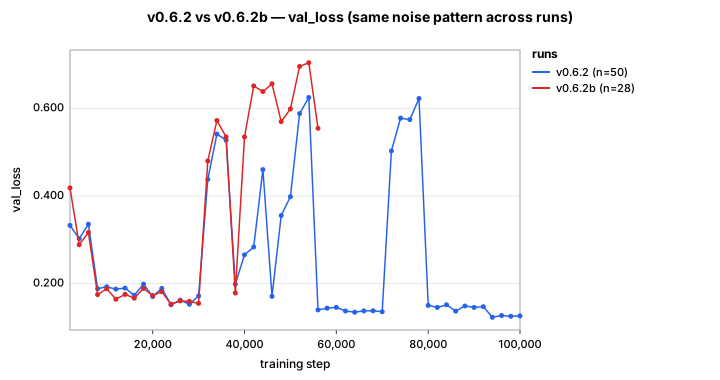
Both runs spike into the 0.4–0.7 range periodically. Initially I read this as overconfidence drift on v0.6.2; the v0.6.2 confidence probe walked that back — the per-tokentokenOne word or subword in the tokenized input. For the neural classifier, tokens come from SentencePiece (subword units); for the rule classifiers, tokens are whitespace- and punctuation-separated words. confidence distributions on the two runs are essentially identical (81.2% vs 81.8% of wrong predictions land at ≥0.9 confidence). The val_loss bouncing is per-batchbatch sizeHow many examples the model processes before each parameter update. Larger batches give smoother gradients but cost more memory; gradient accumulation simulates a big batch on a small GPU. sample variance, not a modelneural classifierThe machine learning model at the core of Mailwoman's parser — a transformer encoder (~30M parameters) trained from scratch to do BIO token classification over addresses. It learns the 'grammar' of address formats; the gazetteer supplies the 'atlas.'-level signal.
val macro_f1 over trainingtrainingThe process of adjusting a model's parameters so its predictions match labeled examples, by repeatedly measuring error and nudging the weights to reduce it. Distinct from inference, when the trained model is run on new input. steps:
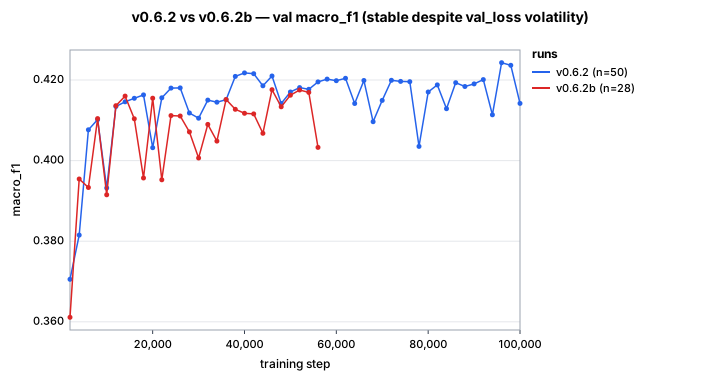
Despite the val_loss volatility, macro_f1 stays within the 0.39–0.42 band for both runs from step ~10K onward. This is the signal that confirms the val_loss spikes are batchbatch sizeHow many examples the model processes before each parameter update. Larger batches give smoother gradients but cost more memory; gradient accumulation simulates a big batch on a small GPU.-specific: a metric that aggregates over the val set's true-positive/false-positive structure doesn't move, while a metric that's sensitive to specific tokentokenOne word or subword in the tokenized input. For the neural classifier, tokens come from SentencePiece (subword units); for the rule classifiers, tokens are whitespace- and punctuation-separated words.-level probability assignments does.
How the charts are built
Two scripts, no library dependency:
# 1. Pull a training-log CSV (committed when the training run ends):
modal volume get mailwoman-training output-v062/train_log.csv /tmp/v062.csv

# 2. Parse into structured JSON:
node scripts/parse-training-log.ts \
  --input /tmp/v062.csv --run-name v0.6.2 --out /tmp/v062.json

# 3. Generate the chart (linear):
node scripts/training-chart.ts \
  --input /tmp/v062.json --input /tmp/v062b.json \
  --metric val_loss --title "v0.6.2 vs v0.6.2b val_loss" \
  --output docs/articles/evals/charts/v06x-val-loss.svg

# 4. Generate the log-scale variant (for the toggle):
node scripts/training-chart.ts \
  --input /tmp/v062.json --input /tmp/v062b.json \
  --metric val_loss --title "v0.6.2 vs v0.6.2b val_loss" --log \
  --output docs/articles/evals/charts/v06x-val-loss-log.svg

# Or transform an existing linear SVG:
node scripts/log-scale-chart.ts \
  --input docs/articles/evals/charts/v06x-val-loss.svg \
  --output docs/articles/evals/charts/v06x-val-loss-log.svg
The parser auto-detects CSV vs modalModalA cloud GPU platform (modal.com) where Mailwoman trains its neural models on NVIDIA A100 GPUs. Training runs are launched via scripts/modal/train_remote.py and typically complete in ~1 hour.-log format. The chart generator accepts
multiple --input arguments for overlay and a --log flag for log10 scale.
Metrics supported: val_loss, macro_f1, train_loss. Output is raw SVG
(no JS, embeds in Docusaurus/GitHub/anywhere).
The <TrainingChart> component provides a Linear / Log toggle by
switching between chart.svg and its chart-log.svg counterpart.
When to read which chart
- val_loss — short-term reading is noisy; the trend matters more than any single evalevalRunning the model against a held-out golden dataset and computing per-component F1, exact-match, calibration, and resolved-coordinate error.. Switch to log scale to examine the low-lossloss functionA number measuring how wrong the model's predictions are on a batch of examples. Training minimizes it. Mailwoman's loss combines per-token negative log-likelihood with the CRF sequence loss. floor; switch back to linear when checking spike magnitudes against the axis range.
- macro_f1 — the steady-stateregionThe first-level administrative subdivision of a country — a US state, a French region, a province. The component between country and locality. quality signal. v0.6.x runs land around 0.40–0.42 by step 20K and don't move much from there. A meaningful improvement looks like sustained higher band, not a single high reading.
- train_loss — diagnostic only. Always drops monotonically (with small wiggle); a NaNNaN (not a number). A floating-point result for an undefined operation (log of a negative, 0/0). Appearing in the training loss usually halts the run; recovering from it follows the NaN protocol. or step-function shows up here first. Log scale reveals the asymptotic tail clearly.
The v0.6.x trainingtrainingThe process of adjusting a model's parameters so its predictions match labeled examples, by repeatedly measuring error and nudging the weights to reduce it. Distinct from inference, when the trained model is run on new input. cadence writes evalevalRunning the model against a held-out golden dataset and computing per-component F1, exact-match, calibration, and resolved-coordinate error. rows every 2K steps and train_loss rows every 50 steps. A 100K-step run produces ~50 evalevalRunning the model against a held-out golden dataset and computing per-component F1, exact-match, calibration, and resolved-coordinate error. points and ~2000 train-lossloss functionA number measuring how wrong the model's predictions are on a batch of examples. Training minimizes it. Mailwoman's loss combines per-token negative log-likelihood with the CRF sequence loss. points.
Limitations
- Charts are SVG, not JavaScript-interactive. The Linear/Log toggle is the only runtime control. For interactive exploration of a single run, open the CSV directly in your tool of choice.
- Multi-run charts only work for runs whose CSVs have been pulled to local (and have been committed to the ModalModalA cloud GPU platform (modal.com) where Mailwoman trains its neural models on NVIDIA A100 GPUs. Training runs are launched via scripts/modal/train_remote.py and typically complete in ~1 hour. volume).
- ModalModalA cloud GPU platform (modal.com) where Mailwoman trains its neural models on NVIDIA A100 GPUs. Training runs are launched via scripts/modal/train_remote.py and typically complete in ~1 hour. app logs only return the last 100 lines by default.
See also
scripts/training-chart.ts— JSON → SVG renderer (supports--log)scripts/log-scale-chart.ts— transforms existing linear SVG → log10scripts/parse-training-log.ts— log → JSON converterdocs/src/components/TrainingChart.tsx— the Linear/Log toggle component- v0.6.2 step 100K eval — embeds these charts in context
- How the model reasons — the architecture context for what these metrics measure